
In this article I will walk through typical decision-making processes within the surgical intensive care unit (SICU) related to respiratory weaning in order to highlight the key requirements associated with that area and to illustrate the importance of medical device connectivity in acute care environments as a necessary adjunct and enabler for complete documentation and clinical decision making at the bedside.
Acquiring Medical Device Data is Key to Clinical Decision Making
Medical device connectivity in the ICU is essential to supporting a complete clinical decision support framework. While electronic medical records in and of themselves offer enormous workflow benefits, the documentation and charting systems are only as good as the data they convey.
Due diligence by care providers can be augmented by automated and validated data collection, achieved through a seamless form of medical device connectivity and interoperability that is supported both inside and outside the enterprise, and follows the patient from the home to the hospital. Yet, as we know, human beings are complex systems of systems.
Decision making in the healthcare enterprise is often made on the basis of multiple parameters and in the context of the patient presentation, setting, and specific conditions relating to the reason for hospitalization and procedures. The data used in clinical decision- making originates from many sources: devices in and around the patient, laboratory and blood tests, films, and ancillary information available both prior to and during the encounter. How often should data be collected? The assessment of clinical needs change depending on the acuity of the patient and conditions present at the point of care.
Updates per care unit drive the quantity of data captured within the bedside documentation, either through flow sheets or paper records. But, the team supporting the patient ultimately must define what is acceptable and required. To support clinical decision making it will also be necessary to include other data from the electronic health record. These include fluid intake and patient output, demographic data, laboratory blood draw assessments, films, etc. Clinical decision-making must be made with data measurements obtained from devices at the bedside and from the ancillary data taken from the electronic medical record.
An Acute Care Scenario
We can learn something of what is required to manage patients effectively by following them through several key departments within the hospital enterprise—a “day in the life” of a patient. In laying out the details of such a scenario, I will draw upon my own experiences at the point of care.
Perhaps there is no better place to consider than the intensive care unit (ICU). The ICU environment cares for the sickest of acutely ill patients. Many patients within ICU environments, and particularly surgical intensive care units (SICU), are technologically dependent on the life-sustaining devices that surround them. Some of these patients are indeed dependent for their very survival on such technologies as infusion pumps, mechanical ventilators, and intra-arterial balloon pumps.
Consider a patient who enters the hospital for a coronary arterial bypass graft, and the workflow and environment surrounding a typical encounter. To this end, I will refer to a former patient, Mr. A. It was determined by Mr. A.’s cardiologist that he had 90% occlusion, or blockage, of three of the coronary arteries supplying his heart muscles with nutrients. As a result, Mr. A was recommended for immediate coronary bypass surgery the following morning.
During the admission process, he is assigned an electronic medical record number along with account and related personal and payer identifying information so as to enable charting and tracking his progress throughout the hospital. As Mr. A. is prepared for surgery, he is moved to a pre-operative waiting area. He receives drugs to reduce the workload on his heart and to prepare him for the anesthesia. He receives sedation and is wheeled to the operating room where his anesthesia and surgical teams prepare him for the procedure. The anesthesiologist manages the patient’s airway, sedation, and monitors vital signs.
In the case of patients receiving coronary bypass grafting in which the heart is stopped, the patient is also placed on a bypass machine that oxygenates the blood and returns it to the body. Vital signs are documented, either automatically or through a paper record, and all drug infusions are recorded by dose, time, rate, and titration. Mechanical ventilators breathe for the patient and replace the exhaled CO2 with oxygen. Upon completion of surgery, the patient is wheeled to surgical intensive care, whereupon mechanical ventilation is continued, vital signs are monitored, and drug infusions are administered.
These devices all create measurements that are used to govern, maintain, and document the status and trajectory of the patient as Mr. A. recovers. Gradually, as the effects of the anesthesia wear off and as heart function becomes more stable and strong, the patient begins to breathe spontaneously. Gradually at first, but increasing over time, measurements documenting the trajectory of spontaneous breathing are captured and used to evaluate patient state and recovery. Laboratory blood gas tests are used to affirm proper physiological, renal, neurological, cardiovascular, and pulmonary function over time. All measurements are recorded within Mr. A.’s medical record.
Physicians write orders guided in part by the patient’s recovering state. These measurements, if recorded automatically from the medical devices, can serve to greatly increase the charting process at the bedside. However, as importantly, they can also serve to guide in clinical decision making by providing the Intensivist, and other attending clinicians, with key information on the state and systemic health of the patient in regard to this immediate procedure.
Data taken from bedside devices can also assist in determining whether the patient is at added risk due to co-morbidities or ailments that can be acquired while in the hospital, such as ventilator- or community-acquired pneumonia or sepsis. The ability to assist the bedside clinician is enhanced greatly through the added benefit of complete, dense, and thoroughly documented information. Charting (or “flow sheeting,” to which it is sometimes referred) involves the documenting of all information relevant to the care of the patient, including vital signs, fluid intake and output, laboratory values, ventilator and respiratory information, and other non-numeric data that provide insight into the care and progress of the patient.
Yet, despite the inordinate amount of data collected at the bedside, these are but a shadow of the patient—an approximation of the state of the individual and this state changes with time. For example, tools and methods that can assist or guide in the weaning of the patient from mechanical ventilation; determine whether the patient is at risk for myocardial infarction or provide insight as to whether the patient is likely to experience other complications, can greatly enhance patient care management and clinical workflow within the intensive care unit, and can result in more homogeneous and stable outcomes for patients. Let’s consider the process of weaning patients from post-operative mechanical ventilation as an example.
Weaning the Patient from Post-Operative Mechanical Ventilation
To assist in visualizing this scenario, refer to the diagram of Figure 1, which illustrates the intra-operative (OR) and post-operative (SICU) processes. Data are collected through a number of sources. As shown, an anesthesia machine is employed to assist in the electronic charting and capture of patient vital signs into the electronic medical or electronic health record. Once surgery is completed, the patient is moved to ICU in which further monitoring and management of the patient continue. Shown are a Swan-Ganz catheter and a mechanical ventilator. These two modalities are used to collect key information required for weaning our patient post-operatively: cardiac output, temperature, cardiovascular function, and respiratory state.
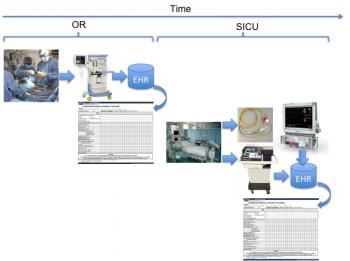
Figure 1: Diagram illustrating high-level intra- and post-operative timeline and key medical devices employed in support of the patient.
The process of weaning a patient from post-operative mechanical ventilation is an important one that consumes a fair amount of time and resources within the SICU environment. Patients are typically weaned according to specific protocols that involve monitoring their spontaneous lung performance and cardiovascular systems to determine whether, during this weaning process, they are receiving sufficient support. While the process is well defined, individual patients can behave differently depending on many factors including physiology, anesthesia dosing, general health of the pulmonary and cardiovascular systems, co-morbidities, etc.
Patients being weaned from mechanical ventilation post-operatively must meet specific physiological criteria prior to being weaned and must be managed closely during the weaning process to ensure that physiological parameters and other data are always maintained within safe and approved thresholds. Examples of such thresholds include chest bleeding less than 100 CCs per hour, warming to normothermia (normal core body temperature), normal blood gas oxygenations in excess of 95%, normal ranges on cardiac output and perfusion ratios, and normal blood gas results.
Data collected both during the post operative weaning process from bedside devices can be compared with data from similar patients so as to provide for an a priori assessment of whether the patient state is evolving normally during the process. Because a patient’s lung function has been compromised due to the strong paralytic drugs administered during surgery, patients tend to arrive dependent on the mechanical ventilator for breathing.
Most (if not all) mechanical ventilators used in the intensive care unit support the capability to communicate data through standard RS-232 ports. The type and quantity of data relate to the settings, mandatory support levels, and patient (or spontaneous) levels. As patients begin to recuperate, their spontaneous support levels evolve from zero to some final value related to full spontaneous support. This is illustrated notionally in Figure 2, which shows patient spontaneous minute volume (that is, the volume of air breathed in a minute’s time) as a function of time after arrival from surgery. The time at which a patient begins to breathe is related to many factors, as stated above. The ability to metabolize the anesthesia is one of these. A patient will begin to breathe slowly and will gain his or her strength over time, as illustrated in this figure. The time at which the patient begins to breathe on his or her own is loosely tied to several factors, including their body mass and core body temperature. Of course, the assumption is that the patient is not being maintained in a sedated state post-operatively. This can be the case and for a variety of reasons. However, we will assume the most typical of cases, in which a patient is being weaned gradually over time.
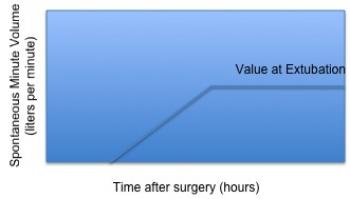
Figure 2: Notional representation of patient respiratory recovery as depicted by post-operative minute volume evolution over time.
Prior to weaning, a patient should achieve normal body temperature to ensure all bodily functions can operate at their optimal levels. The following graph, Figure 3, illustrates a normal re-warming profile of coronary bypass patients recovering from the effects of anesthesia [1]. The horizontal axis represents time from arrival in SICU from surgery. Thus, from the perspective of our patient, Mr. A., we should begin the weaning process as the patient approaches normal body temperature, around 37C.
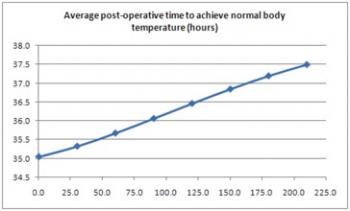
Figure 3: Average time to achieve normal body temperature.
As the effects of the anesthesia wear off and the patient’s respiratory performance returns, the evidence of this improvement and strengthening is visible from the data collected through the ventilator. These data, when charted, provide a visible trend that reflects the patient’s pulmonary and cardiovascular performance. These data can be used to help guide the weaning process as well as confirm and feed back to the clinician the patient’s response to stimulus and treatment during the unconscious state.
The time to achieve spontaneous breathing at a rate of 1 liter per minute was determined in a study of bypass patients in SICU by the author, and is represented according to the plot of Figure 4. In this assessment, the author hypothesized that the time to re-awaken, defined as spontaneous breathing in excess of 1 liter per minute for a period of 10 seconds or longer, was related to the amount of analgesia / anesthesia administered during surgery. The typical anesthetics administered to patients include propothol and fentanyl. The author further hypothesized a linkage between the fentanyl dosing and the re-awakening time. The following plot illustrates a best-fit plot to the original data (r2 = 0.61).
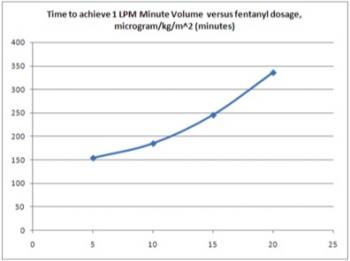
Figure 4: Time to achieve breathing level of 1 liter per minute post-operatively linked to analgesia and anesthetic dosing intra-operatively.
Thus, armed with information related to breathing (available from the mechanical ventilator), core body temperature (available through Swan-Ganz or similar core catheter), and intake & output information from surgery, the clinician can begin to develop an understanding for the expected relationships these may play in terms of guiding patient post-operative weaning. This information is available from previously charted information, from direct medical device connection, and from the surgical flow sheet.
Ultimately, the data collected through the mechanical ventilator are augmented by this information to assist the care provider in guiding patient weaning, in ordering procedures and changes to support that are consistent with the patient’s ability to respond, and help reduce the risk to the patient. The plot of Figure 5 illustrates the mandatory (set) value of respiratory rate and the spontaneous (patient) value of the same parameter during the post- operative weaning process of a coronary bypass graft (CABG) patient [2]. The spontaneous component of this plot is similar to the plot of Figure 2 in shape. As can be seen, the mandatory value of respiratory rate setting is reduced in steps over time. The spontaneous component shows growth to a final value near extubation time. Measurement and collection of these data were through a standard RS-232 serial adapter into a laptop computer.
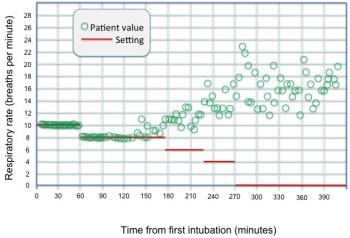
Figure 5: Mandatory and spontaneous respiratory rate plots for patient in question.
We can illustrate with several diagrams where these data can be collected and compared for decision making purposes. Figure 6 illustrates the fentanyl dosing in comparison with the model developed from a larger sampling of patients to provide a rough guide as to viability to wean in terms of expected time after arrival from surgery.
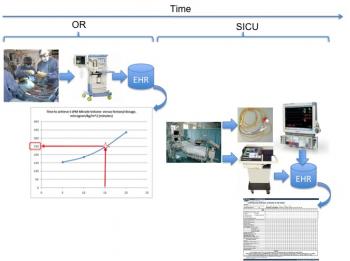
Figure 6: Flow diagram illustrating comparison of patient-specific fentanyl dosing with larger model to indicate relative time to excrete effects of intra-operative drugs.
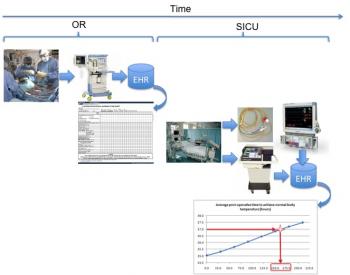
Figure 7: Comparison of patient temperature to illustrate approximate time required to achieve normothermia.
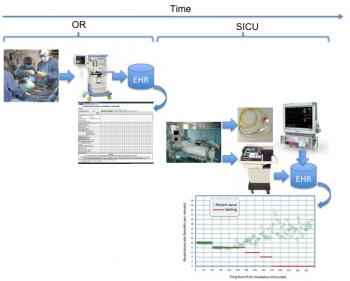
Figure 8: Patient spontaneous respiratory rate in comparison with mandatory settings to provide gauge on viability to wean.
Figure 7 and Figure 8 illustrate the time required to achieve normothermia and the patient respiratory rate performance over time, both collected from bedside monitor and mechanical ventilator, respectively. If we look at the time to reach normothermia and the time required to dissipate the effects of fentanyl in relation to this plot, we have the graph of Figure 9.
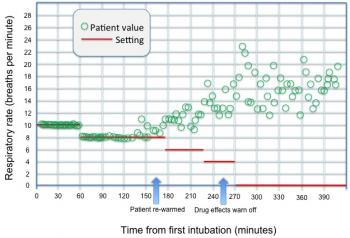
Figure 9: Spontaneous and mandatory respiratory rate with indicators as to when normothermia is achieved and drug effects have dissipated.
As we can see from Figure 9, viability to begin trials for respiratory weaning appears to be achieved after approximately 250 minutes. Of course, other data are also used to assist in making this decision and to determine viability, and expert or related systems cannot be used as a substitute for a bedside clinician. Yet, the possibility to assist and guide the clinician in determining whether it is advisable to proceed can indeed serve a positive end in guiding overall therapy.
Summary
As the patient re-awakens and approaches viability for extubation, it becomes even more important to acquire and analyze measurements from medical devices as these are used to determine whether the patient can be discontinued from mechanical ventilation. The re-awakening time model is a simple but useful tool to guide clinical decision making in the acute setting for a very specific class of patient. Thus, it facilitates the patient care management process in enabling the clinical staff to predict with some reliability when patients require attention during the normal course of care.
Medical device interoperability and integration with external systems becomes essential to clinical decision making ability. There are a number of commercial technologies that support basic interoperability and communication, and I have worked with a number of them. The end in itself is never the ability to merely communicate with a medical device, but, rather, to use the data as a means to assist in making clinical decisions.
Efforts to date in the electronic health record and health information technology areas have focused on documentation, clinical workflow, order entry, notes, and charting. These are all necessary enablers to assist the care provider as a “colleague.” However, clinical decisions are made on the basis of all data presented to the clinician, and involve both real-time and ad-hoc data presented in the form of reports, waveforms, trends, and even hunches based on prior experience. This is the key-- all data, communicated intelligently, filtered and analyzed appropriately, presented clearly-- so as to assist in diagnoses, interventions, therapies, and long-term trending of patient state and care.


John, thank you very much for putting this article together. It’s precise and well researched, and is a great resource for non-clinical and technical personnel (read: box-guys and IT geeks) to understand why clinicians demand the level of integration data integration as they do. It is a vision that is readily achievable today.
However, I do find it strange that in your diagrams an EHR is shown as the direct recipient of device data. EHR could be the final repository for reports, but it would be completely out of scope for an EHR to archive every bit of device data. This should be done by a specialized departmental application (a critical care CIS).
In our institution we have implemented a CIS system that handles those duties. We had an old HP carevue system for ages, but last year we replaced it with a Philips iCIP system. The Philips system has many advantages over carevue, the most clinically significant of those being the ability to correlate different parameters from different devices and create advisories. Our clinicians are working with Philips specialists on creating advisories that highlight when each of the ventilator weaning end-points are reached. The system is also able to monitor protocol compliance (eg. pneumonia prevention protocol for ventilated patients) and generate reminders for actions to be taken for these protocols. It can also generate protocol compliance reports.
The system requires extensive customization since none of the advisories and protocols installed by default satisfied our clinicians. The customization is complicated, requiring both clinicians and our IT team to go deep in to the nuts and bolts of the system, but at least it can be done. A nice GUI based interface would have helped me keep the few hairs I have remaining on my head.
We export reports from the iCIP system to our EHR. We don’t believe that EHR is the correct system to handle all these data streams. Show me an EHR that allows the level of control and customization that a CIS system allows! Sending data to an EHR is as good as writing it down on paper. A good CIS system, on the other hand, can analyze that data and present the data to a clinician in a way that is easily understandable and readily actionable.
Let me finish my rant by complimenting you on this excellent article. Well done!
Pete-
Thanks for the comment and your salient points. I am very familiar with the process of using a more localized system for managing departmental (or detailed-level information), having managed a critical care product line for quite some time. My diagram is abstracted to reflect that these data are stored in a repository. In some cases, these repositories are collections of departmental systems integrated with the larger EHR. The clinical information system is, indeed, the correct starting point. Many EHR vendors with whom I am familiar are looking to blur the lines between the departmental and enterprise systems. My diagram was “designed” in deference to this point.
That said, I am quite familiar with ICIP, and acknowledge your various points in that regard. In the department I run we are investigating future multi-parameter protocols regarding instability that are truly the next generation beyond those in current practice for consideration in future product lines.
Finally, I decided to write this partly to chronicle my own experiences and to provide a somewhat more complete reflection of the process and how various seemingly unrelated events and occurrences need to be considered as part of patient care. I wrote this with respect to the management of my patients during clinical trials and this represents a composite view (at a much higher level) of those patients.
Thank you! This is a nice walkthrough of a workflow an data flow as well as the critical concerns. One issue I’m having. For some reason, I’m not getting the images. I’m using IE 7.0.5730.13CO. Can you tell me how I can get the images or send them to me?
Corrected the link errors. Should be OK now. Thanks for letting us know.